 Dan Moyle
Tasked with generating demand? Need to send qualified leads to your sales team?
If you’re working to be a black belt demand gen ninja, you’ll need to make sure you’re tracking the most important metrics, the best key performance indicators (KPIs).
What does that look like? What kind of dashboard should you build?
Some of the answer depends on exactly what you’re tasked with, but a few KPIs are universal when you’re in charge of demand gen.
With so much data at our fingertips, it’s sometimes difficult to know what to measure, how to report on it, and what to do with it all. Metrics and data are useless unless they’re presented in the right context and provide actionable insights into your demand gen operations. That’s why it’s important to define a well-rounded approach for evaluating your demand generation efforts.
Let’s start with an overview of the types of metrics you can track. Then you can choose the key metrics for your demand gen efforts.
Here are some of the more popular metric categories for demand gen:
Engagement metrics. This is where you measure how your leads and prospects respond to your communications. They should include metrics like site traffic, click-through rates, unsubscribe rates, and read rates.
Performance metrics. Performance metrics are excellent for evaluating the effectiveness of your funnel holistically. These metrics should include a look into marketing qualified leads, sales-accepted leads, and sales cycle length.
ROI metrics. What’s your return on investment? This category is the hard money stats and dollar values that your marketing efforts generated. They will include data like customer acquisition cost, conversion rate, customer lifetime value, and total revenue generated.
A well-rounded demand gen strategy will take metrics of each type into account to paint a complete picture while identifying areas for improvement.
This is how you become a demand gen ninja.
Traffic - More than a Vanity Metric
Let’s start at the beginning. Without visitors coming to your website, you’ll have nothing to measure. You can’t end here, and hang your hat on “Well we have 10,000 visitors a day!” when none of them convert. But you have to at least monitor the health of your website views and your social media presence. Traffic is important. Once you have that as a constant awareness, it’s time to dive deeper.
Cost Per Acquisition (CPA)
Cost per acquisition (CPA) is a critical metric for understanding your marketing ROI. After all, if a campaign doesn’t generate revenue, then it isn’t successful for your business.
Many engagement metrics are great leading indicators of success, but CPA is the financial metric that speaks to the heart of your revenue generation efforts.
CPA is essentially the cost to acquire a single paying customer through a specific campaign or channel. You can also use a similar metric, Cost per lead (CPL) to track your overall spend on a lead-by-lead basis, which is important for knowing how much you have to spend to keep your funnel full.
Calculating CPA
Luckily, calculating your CPA for a specific campaign is relatively simple. It doesn’t require a detailed algorithm or a degree in statistics to calculate and understand.
Calculate your CPA by dividing all of the costs spent on acquiring more customers (marketing expenses) by the number of customers acquired during the period in which the money was spent.
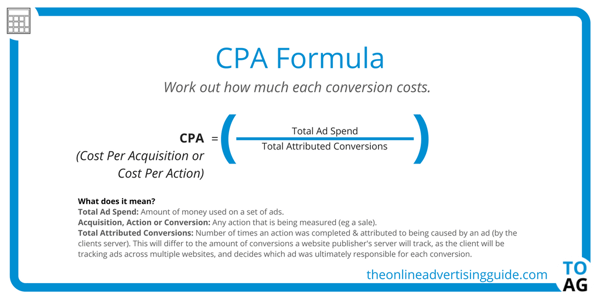
So if your company spent $500 to acquire 100 new customers, your CPA would be $5.00, meaning that you spent $5 to acquire every new customer. The more effective your demand gen funnel is, the lower your CPA will be.
Customer Lifetime Value (CLV)
Want to know the profitability of your marketing campaigns? You’ll need to know just how much money each new customer in the campaigns generate. One of the quickest ways to do so is customer lifetime value (CLV).
Use CLV to predict the revenue that a single customer will generate throughout their lifetime for your business. Then scale this to see how much value your marketing efforts bring the company.
CLV is essentially an average profit from all of your customers. Some customers will generate less and others will generate more.
Many factors can influence your CLV: facets of your marketing, customer service, upselling, and customer service operations. But at its core,it’s the best demand gen metric to determine the profitability of individual campaigns and channels.
A climbing CLV shows a healthy demand generation funnel. It’s not just turning leads into customers, but it generates higher-value customers.
Lead gen funnels play a critical role in the CLV of each customer, as the nurturing process plays a key role in identifying and elevating the highest value prospects to your sales team.
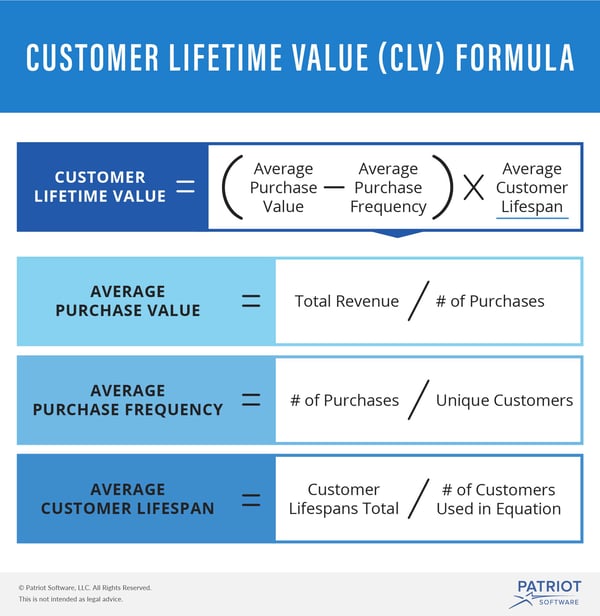
Calculate CLV
Calculate CLV by taking into account the average purchase size of each customer, the number of purchases a customer makes in a year, and the average profit margins to determine a yearly profit margin average per customer.
Then, plug your yearly profit margin into a simple formula that also uses your customer retention rate to determine the lifetime value of each customer that your demand generation funnel brings to the table.
CLV on its own is a significant metric for demand generation funnels. However, it’s most effective when you use it in partnership with other metrics, like cost per acquisition, to examine the overall profitability of your demand generation strategies.
Close Rates per Channel
Close rates is a classic sales metric that can reveal insight into more than just your marketing and sales teams’ performance. It’s an important indicator of how effectively your organization is converting, qualifying and nurturing your marketing-qualified leads (MQLs). Closing percentages can also reveal insight into weaknesses in your demand generation strategy, such as a tendency for leads to drop off in the middle of the funnel.
Do you know how many of your prospects and leads actually become customers? Every experienced digital marketing professional knows the importance of conversion rates. However, in demand generation, there’s more that needs to be taken into account. Your team will get leads from various demand gen channels:
- Inbound website traffic (organic SEO)
- Outbound sales prospecting
- Advertising (PPC, social, traditional ads)
- Referrals
- Social media
Each of these channels can have close rates, CLVs, and marketing budgets that are wildly different from each other. To really become a demand gen ninja, you have to optimize specifically for each channel and appropriately assign your budget toward the highest performing channels.
A careful examination of your close rate per channel could make it clear that certain channels aren’t worth pursuing or that other channels need increased focus as they provide higher close rates and better results. Without tracking your conversion rates by channel, it’s easy to misplace resources and budgets, targeting channels that ultimately provide worse outcomes.
Funnel conversion rates
The entire purpose of your demand gen strategy is to attract high-value customers to your business. You drive traffic to your website through multiple channels, collecting information from prospects along the way and converting them into leads.
The typical demand generation funnel has four basic stages, which can then be broken down into additional stages depending on your strategy:
- Awareness
- Interest
- Consideration
- Decision/Action
As prospects and leads move through your funnel, some will drop out, never moving to the point of sale. Maybe they weren’t really interested in your product but did have some interest in the original marketing materials they engaged with, or they couldn’t afford your product. Maybe it just wasn’t the right time, and they prefer to stay in the “interest” stage until a later date, receiving and occasionally interacting with the content that you send them.
You still have to track how effectively you’re moving prospects through your demand generation funnel and noting whether or not your figures are improving over time.
It’s important to remember that the conversion rates of your demand generation funnel progression depend heavily on the quality of the leads that are being added to the system. If you’re collecting more leads, it may lead to more sales but lower conversion rates at each stage of your demand generation funnel.
Because every business is different, it’s difficult to provide benchmarks that you should be aiming for at each stage of your funnel. Stay focused on continually improving your conversion rates for each jump between stages, and work to improve the quality of your leads and the marketing materials that you deliver to your prospects throughout their buyer’s journey, and you will see small upticks in funnel stage progression at every level.
Bonus Metric: Conversion to MQLs
One of the conversion metrics within this you should monitor is how leads move into a marketing qualified lead designation. That’s a lead qualified for nurturing and retargeting based on meeting pre-defined criteria for lead intelligence. Within a demand generation program, the standards for an MQL should be informed by closed-loop analytics based on total-funnel intelligence.
Measuring the percentage of leads that become MQLs can reveal how effectively your organization is targeting the right prospects on the right channels.
Average Deal Size
Average deal size is the average dollar value of each new, closed customer account that completes the sales cycle. Depending on your organization’s products and services, this may or may not reflect customer lifetime value. This metric provides value in both new and mature demand marketing scenarios, allowing organizations to project revenue and closely-manage pipeline health.
Measuring average deal size by buyer persona can also reveal directives into the types of accounts your organization should target and prioritize.
Focus on Incremental Improvements over Time
For most companies, the demand generation funnel is a large, unwieldy amalgamation of their broader marketing efforts. Becoming a demand gen ninja at your company should include all the metrics above. Then, you can add the tools that make sense for you - always be improving!
Traffic and leads can come from a wide variety of different sources, each moving and converting at different paces through the funnel. This makes industry-standard benchmarks for different metrics throughout the funnel somewhat meaningless unless two funnels share similar traffic sources, strategies, and sales processes.
Instead, companies should spend their time tracking and measuring their success against themselves. Track channels and traffic sources on an individual basis to ensure that you’re spending your time and resources targeting the most productive leads.
Don’t expect overnight success. Becoming that demand gen ninja is all about time and incremental improvement - that’s the key to demand gen funnel optimization. By identifying the most important metrics to track, like the ones outlined in this article, you can build a solid foundation for ongoing funnel optimization that has a real impact on your business.
